Loading Map...

Introduction
Finding a gold mine is a process of ranking and re-ranking. We rank the discrete regions of the Earth’s surface based on their likelihood of meeting the technical, economic and social conditions necessary to get a mine up and running. We devote time and money to furthering our knowledge of the best-looking prospects then shake-up the rankings as this new knowledge dictates. AuVision is meant as a starting point for this process. Using a large database of mineral properties, extensive geographic data, and sophisticated analysis asking the right questions, this product provides a solid foundation for beginning the process of gold exploration.
Mineral Property Database
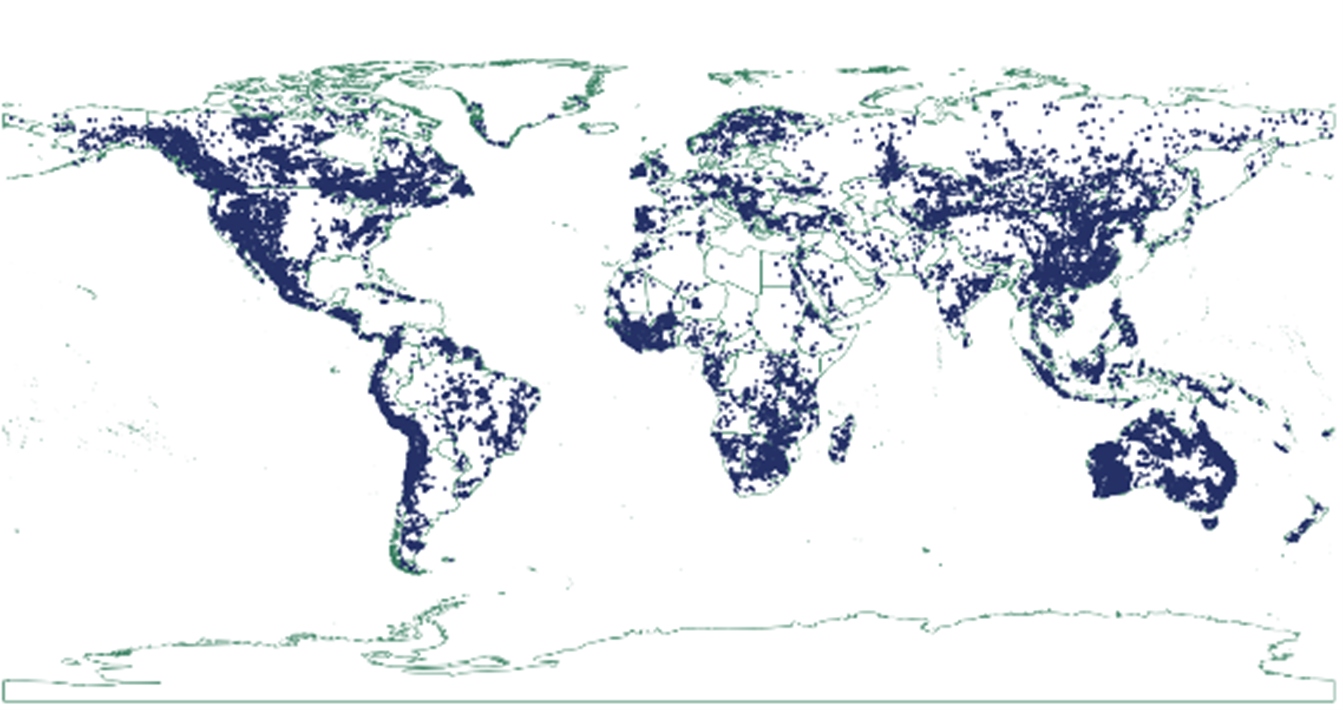
AuVision makes use of a large database of global mineral properties. S&P Global’s Capital IQ Pro platform is a subscription-based service that provides this data. Mineral property data include property coordinates, commodities of interest, and yearly resource and reserve figures including grade and tonnage. The entire database includes approximately 36 thousand mineral properties. Of these, half mention gold as a commodity of interest and 14 thousand list gold as the primary commodity of interest. Not all mineral properties are tracked in this database. S&P Global’s policy is to only track those properties that are drill-ready or better (personal communication).
Figure 1 - World Mineral Property Distribution (data from S&P Global)
Statistical Analysis
With this data in hand, we can begin to answer some interesting and fundamental questions about world gold properties:
- How common are drill-ready gold properties?
- How often do drill-ready targets yield a gold resource?
- If there is a resource, how many tonnes?
- If there is a resource, what is the grade?
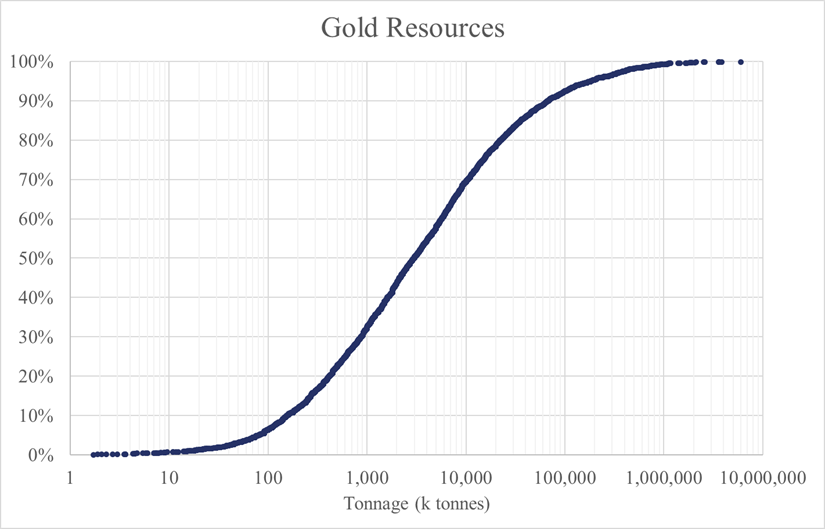
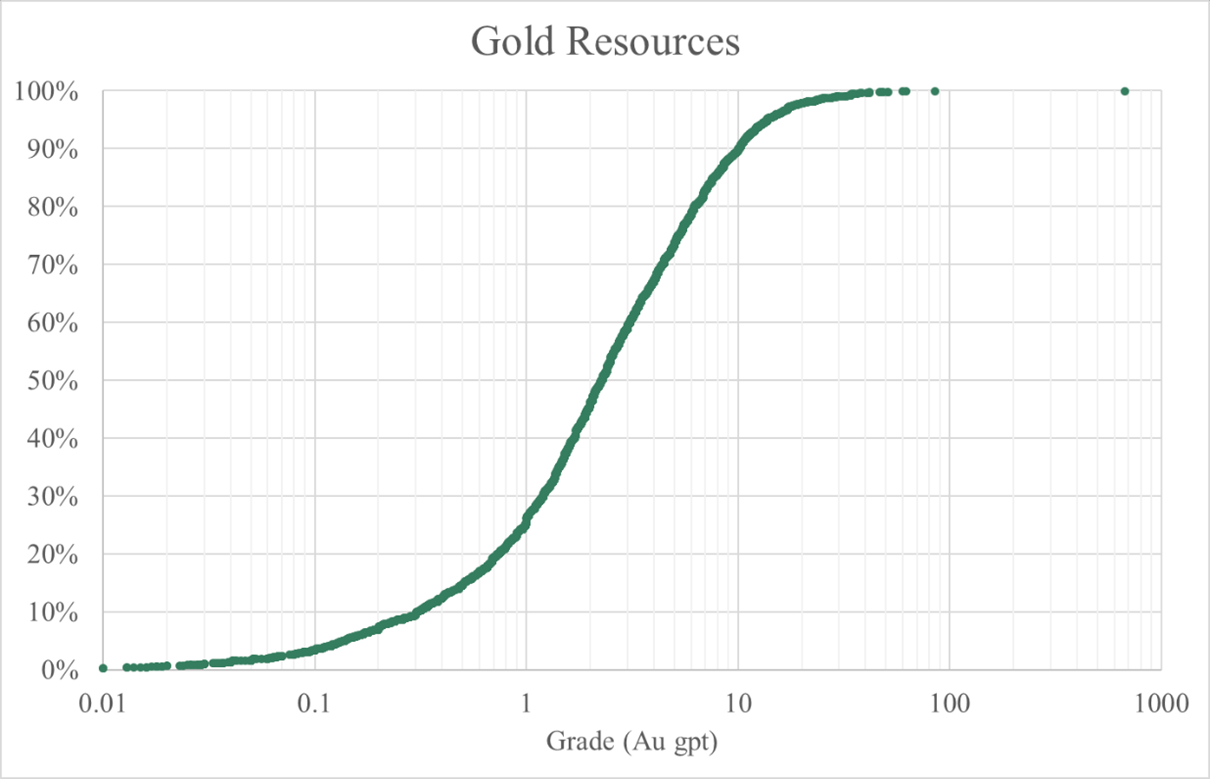
Statistical analysis of the database suggests probabilistic answers to these questions. My own research indicates the typical mineral property size is about 45 km2. Using this as an average implies that the gold properties in the database cover 720k km2 or 0.1% of Earth’s land mass. This informs question 1 above. Give me a random location on dryland and I’ll give you 1 chance in 1000 that it sits within the boundaries of a gold property that is or will become drill-ready. Looking closer at those drill-ready properties we find that only 24% have reported a gold resource. This figure is a great starting point for answering question 2. In a similar vein, Figure 2 and Figure 3 display the distribution of tonnage and grade for those gold resources suggesting a probabilistic answers to questions 3 and 4.
Figure 2 - Gold Resources Tonnage Distribution
Figure 3 - Gold Resources Grade Distribution
Feature Data
While the above statistical analysis is interesting and useful, it can be greatly enhanced by adding more information. And because we know the coordinates of these properties, we can append the database with a considerable amount of geographic information, much of it publicly available.
With the help of GIS (Geographic Information Systems), property coordinates are cross referenced against maps of all sorts. Much of this additional data is geological in nature: GLiM is a high-resolution global lithological map (Hartmann and Moosdorf, 2012); Bouysse (2014) provides a global scale structural map outlining major faults; Lithospheric thickness is modeled by Pasyanos, et. al. (2014); Similarly, Laske and Masters (2010) modeled sedimentary cover across the world.
Other features, while not strictly geological, are also useful. Elevation data from Danielson and Gesch (2011) plays an important role. As does regional climate classification data from Rubel and Kotteck (2010).
Additionally, the spatial relationship between known mineral properties provides significant information. The industry has a saying, the best place to find a new mine is in the shadow of an existing mine. Mineralization tends to cluster together, a phenomenon that can be seen at different scales, from a hand sample to a district. As such, the appended database includes features describing the proximity of other mineral properties and the characteristics of those nearby properties.
Machine Learning
Pulling useful conclusions from this large, multi-dimensional dataset is a challenging task for the human brain. Just imagine all the ways one could filter this data when looking for relationships. To make matters worse, these relationships that may exist have the potential to be quite complex. This is where machine learning can help. Simply put, we tell a computer to explore the data in every conceivable way and keep an accurate record of the features that help reduce our uncertainty for a given question. For example, how does knowing the lithology, elevation and climate help us predict if a drill-read gold property will yield a resource? Effectively, we build the capability of generating specific answers to our fundamental questions (1-4, above) using the unique geological/geographical features of a particular location of interest.
Monte Carlo Simulation
Having built this capability, the next logical step is to create predictions for every place on dry land in the world. For AuVision, we have used a 0.5-degree grid of pixels spanning the continents excluding Antarctica.
In addition to these predictions, a measure of accuracy is also required. This is attained through a technique called 5-fold cross-validation. This technique involves hiding 20% of the data from the Machine Learning algorithm while it builds a predictive model. The predictive power of this model is then tested against the hidden data to see just how well it performs. This process is repeated 4 more times, each hiding a different 20% of the data. This analysis provides the accuracy measurement we need.
With unique predictions for our 4 fundamental questions at each of these locations and measures of their accuracy, Monte Carlo simulation is used to generate 10k equiprobable outcomes for the gold endowment of the ~60k locations analyzed. Combined, these predictions and accuracy scores define probability distributions. During a single simulation, random values are drawn from these distributions indicating whether 1) any drill-ready properties exist, 2) whether any of those yield a gold resource, 3) the tonnage and 4) the grade of said resource.
Analyzing these results is a simple matter of counting. Counting these simulations, one can see how often a given location can be expected to deliver 1M ounces or 10M ounces or, as is usually the case, none at all. Early-stage exploration has long odds, forcing our analysis to focus on rare outcomes. The AuVision shapefile provides this analysis, giving both the 99th and 99.9th percentile outcome for the simulation set of each pixel.
Shapefile File Description
The file au_vision.zip is an archive that includes ESRI shapefiles (.shp, .shx, and .dbf) displaying a world map of gold prospectivity (excluding Antarctica) as interpreted by Tacit Vision, LLC. The map is a mosaic of four-sided polygons each measuring 0.5 degrees wide by 0.5 degrees high (WGS84). Each polygon is appended with various geographic feature data (see below). These features consist of:
- longitude- longitude coordinate of polygon center in degrees (WGS84)
- latitude- latitude coordinate of polygon center in degrees (WGS84)
- area_sqkm- area of polygon in square kilometers
- country- name of country in which polygon is located
- koppen_1- Part 1 of the three-part Köppen climate classification
- koppen_2- Part 2 of the three-part Köppen climate classification
- koppen_3- Part 3 of the three-part Köppen climate classification
- lith_dpth- Depth of the lithosphere in kilometers
- tectonic_p- Tectonic province
- province_a- Geologic age of tectonic province
- general_ge- General description of geology
- lith_desc- Lithology description
- sed_cover- Thickness of sedimentary cover
- fault- Distance to nearest regional-scale fault measured in degrees (WGS84)
- elevation- Elevation in meters
- auoz_p99- Interpreted gold endowment for a 99th percentile (1 chance in 100) event
- auoz_p999- Interpreted gold endowment for a 999th percentile (1 chance in 1000) event
- auprop%- Interpreted probability for 1 or more drill-ready gold properties within the polygon
References
Bouysse, Philippe & Ccgm, Cgmw. (2014). Geological Map of the World at 1:35 M 3rd edition, revised (2014). 10.14682/2014CGM3R.
Danielson, J. and Gesch, D. 2011. Global Multi-resolution Terrain Elevation Data 2010 (GMTED2010). United States Geological Survey Open-File Report 2011-1073.
Hartmann, J. and Moosdorf, N. 2012. The new global lithological map database GLiM: A representation of rock properties at the Earth surface. Geochemistry, Geophysics, Geosystems. 13(12):1-37.
Laske, G. and Masters, M. 2010. A Global Digital map of Sediment Thickness. https://igppweb.ucsd.edu/~gabi/sediment.html
Pasyanos, M.E., T.G. Masters, G. Laske, and Z. Ma (2014). LITHO1.0: An updated crust and lithospheric model of the Earth. J. Geophys. Res. 119 (3): 2153-2173, DOI: 10.1002/2013JB010626.
Rubel, F., and M. Kottek. 2010. Observed and projected climate shifts 1901-2100 depicted by world maps of the Köppen-Geiger climate classification. Meteorol. Z., 19, 135-141. DOI: 10.1127/0941-2948/2010/0430.