TSX/TSXV Market Capitalization
May 14, 2021
What are mining companies worth today in the eyes of the market? How are company valuations, as measured by market capitalization, distributed. How can machine learning help clarify what correlates with value? I'm chasing answers to these questions by focusing on mining companies that are publicly traded on either the TSX or TSXV exchanges in Canada. Why those? Easy access to data.
I found a great link on the TSX website where you can download an Excel file providing all mining companies listed on either the TSX or TSXV accompanied by their Market Capitalization and several additional features about each company.
A quick look at the market cap data alone speaks volumes. Mining is a winner-take-all type of industry where a tiny fraction of companies account for the majority of the total value. The two top dogs alone, Newmont and Barrick, account for 20% of the total market cap of the entire list. Have a look at the cumulative distribution graphs below and note the logarithmic scale for market cap.

This type of inequality is not new. Vilfredo Pareto spotted a similar phenomenon over 100 years ago when looking at wealth distribution in Italy, noting that 20% of the population owned 80% of the land. I took a similar approach, comparing the market cap of TSX/TSXV listed companies for various industries to produce the table below. All industries, and not least mining, show even greater inequality than proposed by Pareto’s famous 80/20 rule. Using data distributed in such a manner is tricky. Statistical parameters such as mean and standard deviation are dominated by the favored few values at the extreme and become significantly less informative.
| Industry | Top 20%* |
|---|---|
| Technology | 98% |
| Mining | 96% |
| Oil & Gas | 95% |
| Financial Services | 93% |
| Industrial Products & Services | 91% |
| Consumer Products & Services | 98% |
| Life Sciences | 89% |
*Percent of total market capitalization of TSX/TSXV listed companies found in the largest top 20%
Referring back to the mining company dataset, we can see other pieces of information or 'features' for these companies such as their regions of operation, commodities of focus and listing information. Given my interest in market cap, it’s natural to raise the question: How do these other features relate to the company’s market cap?
Having taken an interest in machine learning, I’ve learned a few tricks to tease out hidden patterns in data. Applying a clever algorithm called RReleifF to our mining company data reveals which features are the most useful in predicting the market cap. Based on this algorithm, the top 5 are:
- Listing Type: Describes how companies landed on their respective exchange. Examples include the typical Initial Public Offering (IPO), former TSXV company graduating to the TSX and vice versa, and the IPO of a Capital Pool Company.
- Index Component: Is the company included as a component in an index such as the S&P/TSX 60 or the S&P/TSX Venture Composite Index?
- Exchange/Tier: Is the company listed on the TSX. If its the TSXV, is it a Tier 1 (i.e. premiere) or Tier 2 company? No surprises here given that the TSX is reserved for better established companies.
- Gold: Is gold one of the commodities of focus for the company?
- Canada: Is the company operating in Canada?
Here's another question: How well do these features, working as an ensemble, predict the market cap of a company? To answer this, I reach once more into my bag of machine learning tricks and pull out a handful of algorithms from linear regression to a neural network. I pocket a small fraction of the data (10%) and shove the rest through these algorithms, allowing them to spot patterns between market cap and the various features. Once trained-up, the algorithms spit-out predictive models that I can play with. I test the predictive power of these models by feeding in the features of the data I saved in my pocket and see how close their market cap predictions are to the truth. In the end, my Adaptive Boosting algorithm (great explanation found here) prevailed as the most precise.
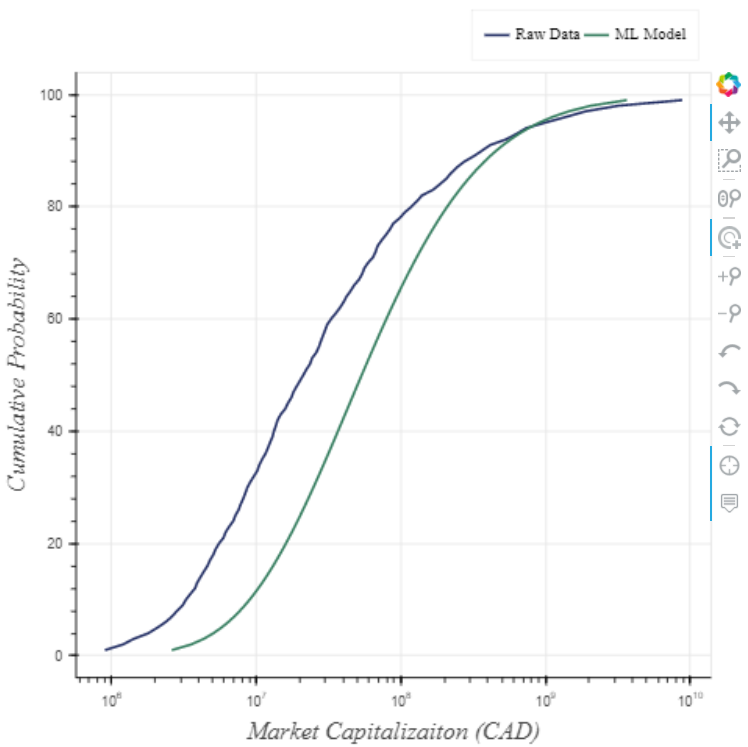
Just how precise are those predictions? Not much. In those cumulative frequency graphs above, I see a wide range or spread of values for market cap caused by all manner of factors. My model can explain away some of that variability, but only about 20-25%*. The figure below helps illustrate the point. The ‘Raw Data’ cumulative frequency curve (market caps of all mining companies) states 60% of company market caps will fall between CAD $6M and $122M. The ‘ML Model’ curve, on the other hand, predicts a range of CAD $16M and $210M at 60% confidence using features of a company whose market cap I know to be $125M. A more precise model would provide a tighter range approaching a vertical line.
Why is the model so imprecise? Lack of feature data. There’s a metric tonne of information about these companies that is not present in our data set. While much of that information is unknowable to humankind, I'm comfortable saying there’s plenty of recorded knowledge that could improve the model precision to a far greater extent. Imagine what we could do if the dataset included production figures, resources/reserves, or the criminal record of the management team?
For what it’s worth, I’ve made the predictive model available on my website. Follow this link and play around with the inputs. You might just find a company that is under-appreciated and consequently under valued, the proverbial “diamond in the rough.”
*I'm using a bunch of data transformations to get the market cap distribution looking nearly Gaussian and calculating Mean Absolute Deviations to make this claim.